A neural network learning to recognize digits. Each pixel represents a weight of the network.
Visualizing a neural network
Training a Neural network to perform well is not an easy task. The many layers of neurons, each having lots of weights and biases often add up to several millions of parameters to configure trough learning. Understanding what these parameters do by looking at them as raw data is not possible, thus we need somehow visualuze what the network does. Beside the architecture of the network, we also have to choose and tune a range of training parameters as well, such as activation function, regularization parameters and cost function that, to be tuned well, require some rough idea of what the network does.
A neural network learning to recognize digits. Each pixel represents a weight of the network.
In a conventional algorithm choosing an optimal structure for the data the algorithm operates on can be relatively easily figured out by analyzing the cost of the algorithm and conducting measurements. Debugging such an algorithm is also relatively straightforward with many advanced tools available. In the case of neural networks however it is often very difficult to understand what a network had eventually learned to do during a training, let alone guessing it beforehand. And when a network is not behaving like expected, the familiar debugging tools are not that helpful in figuring out where the issue lies. In some cases however such as image recognition problems we can sort of visualize what the network is trying to learn and gain some insight into the learning process. Let's see an example to that.
The MNIST dataset of hand-written digits is a classic example to introduce machine learning on. This dataset contains pictures of hand-written numbers from 0 to 9 and are annotated with the number that is drawn on them. The size of the pictures is 28x28 pixels, (in total 784 pixels). As such, the data can be used to train a neural network using the pictures as inputs, and the corresponding number as the desired output. There are 60,000 training examples and 10,000 test examples in the dataset to train and test on.
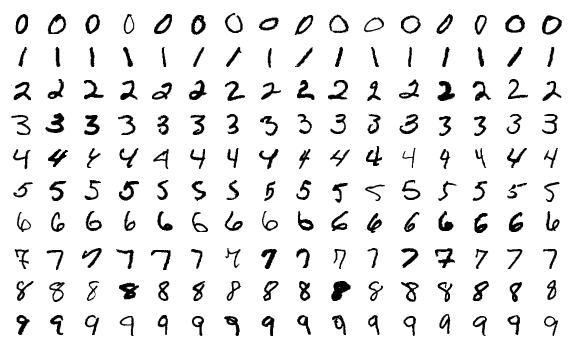
Some example images from the MNIST dataset
To try things out, I trained a very simple network using my neural network library with the following parameters:
The network was initialized using the Xavier initialization that provides a good randomized starting point for a network to be trained. The total number of weights and biases is 50,890. The training was run for 230 epochs on the 60,000 training examples using 500 sized mini-batches randomized before each epoch.
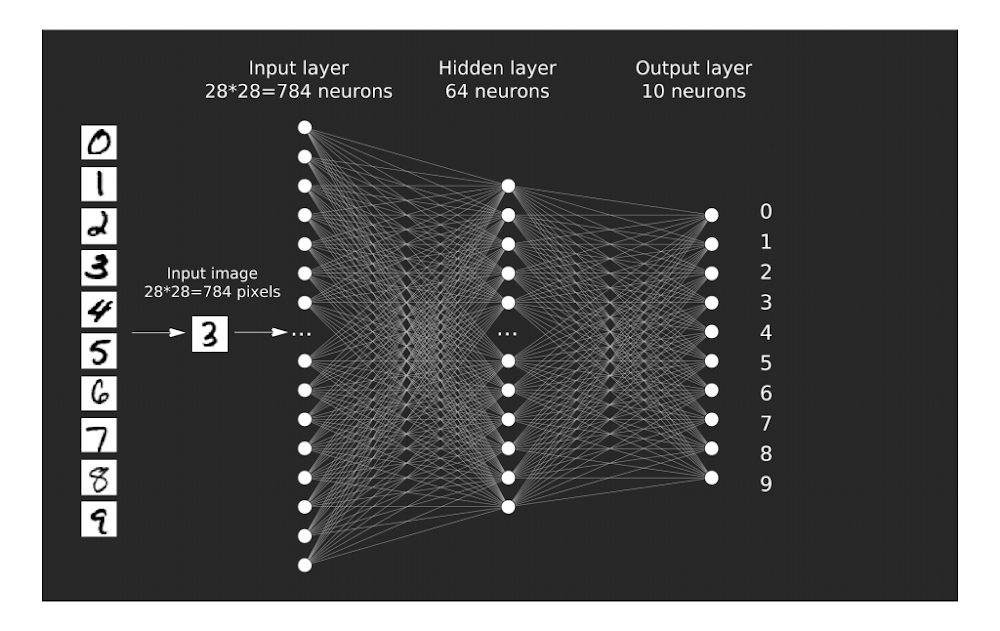
The structure of the network
After each epoch the performance of the network was measured against the 10,000 test examples from the dataset. The tests were showing promising results very early on. From the initial state, where the network answered 8.92% of the tested examples right (a mere random guess would result in a ~10% success rate), after 4 epochs it surpassed the 50% mark. 80% was reached in the 17th epoch, and 90% in the 79th epoch. After 230 epochs the training finished at a success rate of ~92.5%.
Here you can try out the result of the network. Draw a number using your mouse or your touchscreen and press the 'What did I draw?' button!
Draw a number from 0 to 9!
It doesn't really work! Seeing a more than 90% success rate caused high expectations, but after trying some of my own drawings on the network it became apparent that the network is failing to recognize hand written digits. Around 3 out of 10 of my attempts were successful and that is very far from 90%.
So what is going on here? To gain a better understanding of why the network fails to recognize our own drawings let's try to visualize the neurons during training in a way that makes sense of the data and see if we can find out whats happening!
On the next video, you can follow trough the learning process epoch by epoch. In the Hidden layer section you can see the 64 neurons of the Hidden layer in a 8x8 arrangement. Each neuron is a 28x28 grid, showing red pixels for positive weights, and blue pixels for negative weights as they connect to the Input layer (that is essentially the input image). The bias (or negative threshold) is also visible as a vertical bar on the right side of the weights. Yellow is for positive biases and green is for negative ones. The Output layer consists of 10 neurons, each having 8x8 weights connecting to each of the neurons in the Hidden layer.
As the network is learning you can see some curly patterns emerging from the initial random noise. Those patterns are the common parts of numeric digits that the network generalized to. Looking at this image, it seems like each neuron in the Hidden layer is sort of like a function in a programming language, meaning that a following layer (in this case the Output layer) can use the Hidden layer's neurons as if they were functions implementing some abstracted behavior. By adjusting a weight in one of the the Output layer's neurons, it can selectively discard or use the result of the corresponding 'function' in the Hidden layer. This is a very powerful way to process things. Imagine having a programming language, where you are not allowed to use any functions: you would have to copy-paste a lot of code around meaning that you'd use up a lot more space due to the more instructions. Using multiple layers in a network therefore allows us to use way less total neurons to achieve similiar results.
The patterns that have emerged in the Hidden layer are quite interesting. As we discussed they are probably some generalization of hand-drawn numbers, an efficient, compact way of differentiating from one digit to an other. Looking at them closely reveals some interesting property though: they seem to be noticably centered inside the 28x28 pixel sized region. Could this mean that the MNIST data was somehow pre-processed? The MNIST dataset's description reveals that in fact this is the case:
❞
The images were centered in a 28x28 image by computing the center of mass of the pixels, and translating the image so as to position this point at the center of the 28x28 field.
That's the issue! The previous drawing applet didn't actually take that into consideration, and as the network only ever encountered images that were previously centered, it only learned to recognize those. The solution now seems simple: Calculate the center of mass for the image that is drawn, and translate the image so that it is in the middle of the 28x28 region. This fixes the issue entirely, providing a network that can actually recognize digits. Try out the fixed version here:
Draw a number from 0 to 9!
We could also randomly translate the input images and train the network on that, but that is an unnecessarily harder problem for a network to solve. A conventional algorithm is perfectly suitable for this task. Additionally the translation might not be enough, for even better results we should fit the size of the drawing to the 28x28 pixel grid.
One other interesting insight that we can gain from this visualization, is that the 64 neurons of the Hidden layer are in fact more than what the network needs. Pause the video at the end of the learning process, and you'll see that out of the 64 neurons in the Hidden layer, around 12 of them are noticably dimmer than the rest. It seems like that these neurons have very little impact on the final result, and their values are not that important. If you focus on the top-left neuron on the 8x8 grid, you can see that not only it is very dim, but also none the Output layer's 10 neurons reference that top-left neuron with a high enough weight to matter, meaning that it is a mostly redundant. This is a direct hint that we could reduce the neuron count in the Hidden layer to speed up learning.
Thanks for reading. If you would like to experiment with this network, you can download it in JSON format by clicking here. Also you can check out my C# Neural Network library called machine.academy, featuring GPU acceleration.
The SVG image of the network's structure was made using this awesome tool available online.
